Relaxation Induced by Microwave Resonance Therapy: EEG Correlates
By
Dejan
Radenovic1, Dejan Rakovic1, 2 , Zlata
Jovanovic-Ignjatic3, Milorad Tomasevic4,
Vlada
Radivojevic5, Emil Jovanov 1, 6
e-mail: jovanov@ieee.org
1Faculty of Electrical Engineering, PO Box 35-54, 11120
Belgrade, Yugoslavia
2European Centre for Peace and Development
(ECPD) of the United Nations University for Peace,
Terazije 41, Belgrade,
Yugoslavia
3Private Medical Practice ?Lav?, Vlade Zecevica 14,
Belgrade, Yugoslavia
4Vinca Institute of Nuclear Sciences,
Belgrade, Yugoslavia
5Institute for Mental Health, Department of
Clinical Neurophysiology,
Palmoticeva 37, Belgrade, Yugoslavia
6Electrical and Computer Engineering Dept.
The University of Alabama in Huntsville
Abstract
Microwave Resonance Therapy (MRT) as a novel medical treatment
represents a synthesis of the ancient Chinese traditional knowledge in medicine
(acupuncture) and recent breakthroughs in biophysics. Affecting the appropriate
acupuncture points by the generator of high frequency microwaves (52-78 GHz),
significant clinical results of the treatment are being achieved. In this paper
the EEG correlates of the MRT effects on psychophysical relaxation are evaluated
within a group of 28 adults. Upon the MRT application, a few-percentage
decrease in the EEG power is observed in most subjects ? suggesting some
relaxation MRT effect. Such a tendency is particularly significant in the theta
frequency band (4-8 Hz), which might be related to the resonance sensitivity of
the acupuncture system in this ultralowfrequency (ULF) region.
1. Introduction
The yin-yang concept of acupuncture, affecting the network of energy-information processes of an organism, represents one of the most specific and most useful segments of the renowned Chinese traditional medicine [1]. Indian traditional medicine, and especially one of its most prominent representatives, swara yoga, is also acquainted with an energy system analogous to the Chinese acupuncture system: in Indian terminology the qi entity is known as prana, and meridians as nadis (14 of them being basic, like in acupuncture, although 3 of them are of special medical and spiritual significance) [2]. In the definition of contemporary scientific acupuncturology it can be said that acupuncture deals with somatotrophic representation of organs and tissues on the surface of the body, on the extra-bioactive acupuncture (trigger) skin points. Biophysical activation of acupuncture points (by sticking metallic needles, but also by heat, pressure, magnets, weak laser beam, ultralowfrequency currents, microwave resonance, aeroionic, and biotherapeutic stimulation [1]), produces effects which are manifestation of the nervous (peripheral, autonomous, and central) and endocrine systems, owing to interaction and integration of sensitive stimuli.
Besides its practical medical aspects, Chinese traditional medicine is deeply colored with mystical connotations, which was one of the reasons why Western science has been hardly accepting experiences of Eastern tradition. The second reason was that within the 12 visceral organs corresponding to the 12 paired meridians, Chinese tradition has not included the brain and endocrine glands: however, in the past few decades it was found that the acupuncture system was in close functional interaction with both central nervous system and endocrine system, as well as with peripheral and autonomous nervous systems [1]. The final reason was a lack of clear anatomical basis of the Chinese acupuncture system. However, new investigations of gap junctions (specific intercell channels, whose ionic conductivity between excitable cells can be modulated by intracell pH-factor, Ca2+-ions, neurotransmitters and second messengers, and even by voltage) have shown significant increase of concentration inside the acupuncture points and meridians [3].
A better organization of cell structures and an ionic basis of the qi entity of the acupuncture system is also suggested by approximately 10 times lower skin electrical conductivity of the acupuncture points in respect to the surrounding tissue, as well as much higher reabsorption of aeroions in these points [1]. Theoretical predictions of the biophysical model of altered states of consciousness also imply an ionic nature of the qi entity of the acupuncture system, with possibility of its partial displacements from the skin surface in these states [4]. Ionic acupuncture currents, and accompanying electromagnetic fields, have ultralowfrequency (ULF) and microwave (MW) components, i.e. the MW component is modulated by the ULF component: in support to the ULF nature of ionic currents in acupuncture channels, one can cite the resonance ULF (~ 4 Hz) stimulation of the acupuncture analgesia endorfin mechanism [5]: on the other hand, the evidence for the MW component of ionic acupuncture currents is provided by resonance MW (~ 52-78 GHz) therapy, efficient even in very serious diseases [6,7].
The inventors of the microwave resonance therapy (MRT), former Soviet scientist Sit'ko and his coworkers [6], proposed in early 1980?s that acupuncture system represents a dynamic structure, differentiated at the locations of maximums of three-dimensional standing waves, formed as a result of the reflection of coherent microwave (~ 100 GHz [8] Fr?hlich excitations) of molecular subunits in the cell membranes and proteins - supported also by other investigations which have demonstrated that differentiation of gap junctions (of higher density at acupuncture points and meridians) is slightly sensitive to voltage [5]. In the above context an explanation of MRT efficiency, as noninvasive nonmedicamentous medical treatment, should be sought [7]: some disorders in the organism give rise to deformation in the three-dimensional standing wave structure of electrical field of the organism in MW region, which influences corresponding changes in spatial structure of the acupuncture system, and consequently its resonance frequency, resulting in some disease. During the therapy, applying the MW sound at corresponding acupuncture point the excited acupuncture system of the patient is relaxing to the previous healthy condition, while reaching its normal resonance frequency response upon the wide spectrum MW source - and following to physiological mechanisms of the acupuncture regulation [1] the organism biochemically overcomes the disease.
It is experimentally demonstrated that the organism is resonancely sensitive to the 1% frequency changes in MW range of 52-78 GHz, as observed in the EEG, ECG, pulse normalizing, change in tension and respiratory rhythm [6]. At the moment of establishing resonance frequency, the patient?s sensory response can be manifested as local (feeling of warmth, pricking, weight, goosflesh, bites, or cold at the contact point), systemic (related to organ or system), and general (in the form of comfortable and uncomfortable reactions).
The recommended MRT treatment at an acupuncture point is at last 10 minutes, while the duration of the whole treatment is maximum 20 minutes, applied daily or bidaily. 10 treatments in a course are applied, with a minimum pause of 21 days and optimally one month, in the case a repeated course is necessary. The courses of prophylaxis are advised every 6 months, concerning psychophysiological relaxation too. This motivated us to start investigation of the MRT-induced relaxation effects on EEG changes [9].
2. Method
SUBJECTS - The study was carried out on 28 healthy adult volunteers (13 males and 15 females)
APPARATUS - Electroencephalographs were recording by a MEDELEC 1A97 EEG machine, with lower and upper band-pass filter limits set at 0.5 Hz and 30 Hz, respectively. Silver chloride electrodes were placed at 16 locations (F7, F8, T3, T4, T5, T6, Fp1, Fp2, F3, F4, C3, C4, P3, P4, O1, O2) according to the International 10-20 system, with average reference. The EEG outputs were digitized with 12 bit precision at a sampling rate of 128 Hz per channel using A/D converter Data Translation 2801
PROCEDURE - The experiment was conducted in a sound-proof room, dimly lit for observation. Subjects were laid comfortably. Each recording session was divided into three sequential periods:
- relaxing 5 min with eyes closed;
- MRT 20 min;
- relaxing 5 min with eyes closed.
During those periods two random samples, one minute each, were recorded for every subjects. The EEG record was stored on a hard-disc.
The MRT was applied by the wide spectrum apparatus POROG-3, and the measurement of frequency was achieved by the narrow spectrum apparatus AMRT-01, adjusted manually. The frequency range of the POROG-3 is 52-78 GHz. Up to 10 mW low-power microwave generators, of the output power density of 0.2-5 m W/cm2 - much lower than biologically limited 10 mW/cm2 during 8 hours, as prescribed by USA National Standards, or 10 m W/cm2 during 8 hours, as prescribed by Russian and Ukrainian National Standards [6] - are power supplied by the 220? 22V/50Hz a.c. or the autonomous 4.5V d.c. The output power density as well as the seance duration significantly influence the MW absorbed dose and corresponding MRT bioeffects, which can be biostimulative for low-level therapeutically recommended doses of typical 20-minute daily MRT treatments (causing local temperature increases up to 38? C, with maximally fast bioeffect), and biodepressive and even biodestructive for much higher doses (causing much higher and harmful local temperature increases) [6]. MRT generator was applied on acupuncture points in the following order: Du 20, and the left-side points Li 4, Pc 6, H 7 and Ap 55, which resulted in relaxation, similarly to the parasympathicus effect [1]. The choice of the acupuncture points for the relaxation seance was achieved on the basis of well known principles of acupuncture stimulation, characteristics of the chosen points, and the therapeutist experience.
DATA ANALYSIS - Time-varying EEG spectra (spectrograms) with 0.5 Hz resolution were calculated by the MATLAB program using a 256-point FFT algorithm performed on 2 sec Hamming-windowed half-overlapping epochs. An array of EEG partial power spectra for each subject and each derivation was computed by integration by the trapezoidal rule of the spectrogram over the five frequency bands.
The coherence spectral arrays was estimated using Welch?s averaged periodogram method at 512-point (4 sec) epochs of EEG data divided into 256-point (2 sec) detrended Hamming-windowed subjects with 240-point overlap. Total coherence for the each frequency band was calculated using the same methods as those described by Levine et al. [10]. Within every frequency band, at any moment, the maximal value of the coherence was taken
Table 1. Adopted frequency intervals for the EEG power and coherence analyses
| FREQUENCY | FREQUENCY INTERVAL | |
| BAND | POWER |
COHERENCE |
| DELTA | 1 - 4 Hz | 1 - 3.5 Hz |
| THETA | 4 - 8 Hz | 4 - 7.5 Hz |
| ALPHA | 8 - 13 Hz | 8 - 12.5 Hz |
| BETA1 | 13 - 18 Hz | 13 - 17.5 Hz |
| BETA2 | 18 - 30 Hz | 18 - 29.5 Hz |
We have adopted as significant changes only those observed in more than 50% subjects. In Table 1 the adopted frequency intervals for every frequency band used in the power and coherence analyses are presented.
Since those arrays are not distributed in a Gaussian manner, the Mann-Whitney U-test and Wilcoxon matched pairs test were used to determine significant differences between the spectral arrays of the pre-therapy period and the spectral arrays of the after therapy period.
3. Results
3.1. Power analysis
The subjects were classified in to two groups: group 1 (11 subjects) not previously subjected to the MRT treatment, and group 2 (17 subjects) being subjected to the MRT in the past two years. In Table 2 a survey of significant changes (p < 0.05, obtained by the Wilcoxon test for corresponding pairs of channels) of the EEG power in all frequency bands over a whole head is given, while in Tables 3 and 4 such surveys for all EEG channels are presented.
Table 2. The number of subjects with significant changes of the EEG power over the whole head, for the two groups (group 1, having not ever been previously MRT treated; group 2, previously MRT treated) in all frequency bands; the frequency bands with corresponding changes observed in more than 50% subjects are shaded.
| GROUP | TYPE OF | FREQUENCY BANDS | |||||||||
| CHANGE | delta | theta | alpha | beta1 | beta2 | ||||||
|
significant increase | 2 | 18% | 0 | 0% | 3 | 27% |
5 | 45% | 2 | 18% | |
| 1 | significant decrease | 0 | 0% | 2 | 18% | 6 | 55% |
5 | 45% | 3 | 27% |
| not significant | 9 | 82% | 9 | 82% | 2 | 18% | 1 | 10% | 6 | 55% | |
| significant increase |
4 | 24% | 3 | 17% | 4 | 24% |
2 | 12% | 5 | 29% | |
| 2 | significant decrease | 5 | 29% |
4 | 24% | 5 | 29% | 7 | 41% | 2 | 12% |
| not significant | 8 | 47% | 10 | 59% | 8 | 47% | 8 | 47% | 10 | 59% | |
| significant increase |
6 | 21% | 3 | 11% | 7 | 25% | 7 | 25% |
7 | 25% | |
| 1 & 2 | significant decrease |
5 | 18% | 6 | 21% | 11 | 39% | 12 | 43% |
5 | 18% |
|
not significant | 17 | 61% | 19 | 68% | 10 | 36% | 9 | 32% | 16 | 57% | |
Table 3. The number of subjects with significant changes of the EEG power for all channels of the group 1 (11 subjects); the channels with the band power changes in more than 50% subjects are shaded.
| FREQUENCY BANDS | |||||||||||||||
| CHANNELS | delta | theta | alpha | beta1 | beta2 | ||||||||||
|
+ | - | S |
+ | - | S |
+ | - | S |
+ | - | S |
+ | - | S | |
| 1 - F7 | 1 | 3 | 4 | 1 | 1 | 2 | 2 | 5 | 7 | 2 | 3 | 5 | 2 | 2 | 4 |
| 2 - F8 | 1 | 5 | 6 | 0 | 2 | 2 | 2 | 3 | 5 | 2 | 3 | 5 | 1 | 4 | 5 |
| 3 - T3 | 5 | 4 | 9 | 2 | 2 | 4 | 3 | 4 | 7 | 5 | 3 | 8 | 4 | 3 | 7 |
| 4 - T4 | 4 | 1 | 5 | 3 | 0 | 3 | 5 | 2 | 7 | 4 | 2 | 6 | 5 | 1 | 6 |
| 5 - T5 | 3 | 2 | 5 | 5 | 2 | 7 | 4 | 3 | 7 | 2 | 2 | 4 | 3 | 3 | 6 |
| 6 - T6 | 3 | 3 | 6 | 0 | 4 | 4 | 2 | 2 | 4 | 3 | 4 | 7 | 2 | 2 | 4 |
| 9 - F3 | 1 | 5 | 6 | 0 | 3 | 3 | 3 | 3 | 6 | 3 | 3 | 6 | 4 | 1 | 5 |
| 10 - F4 | 4 | 3 | 7 | 2 | 1 | 3 | 3 | 3 | 6 | 5 | 2 | 7 | 5 | 0 | 5 |
| 11 - C3 | 2 | 5 | 7 | 2 | 3 | 5 | 3 | 3 | 6 | 4 | 2 | 6 | 3 | 3 | 6 |
| 12 - C4 | 4 | 1 | 5 | 2 | 2 | 4 | 4 | 2 | 6 | 4 | 2 | 6 | 7 | 3 | 10 |
| 13 - P3 | 2 | 2 | 4 | 2 | 2 | 4 | 5 | 4 | 9 | 1 | 4 | 5 | 2 | 4 | 6 |
| 14 - P4 | 3 | 3 | 6 | 0 | 2 | 2 | 3 | 4 | 7 | 3 | 2 | 5 | 3 | 2 | 5 |
| 15 - O1 | 3 | 3 | 6 | 2 | 4 | 6 | 3 | 3 | 6 | 1 | 5 | 6 | 2 | 3 | 5 |
| 16 - O2 | 1 | 3 | 4 | 0 | 4 | 4 | 3 | 5 | 8 | 1 | 7 | 8 | 2 | 3 | 5 |
Table 4. The number of subjects with significant changes of the EEG power for all channels of the group 2 (17 subjects); the channels with the band power changes in more than 50% subjects are shade.
|
FREQUENCY BANDS | |||||||||||||||
| CHANNELS | delta | theta | alpha | beta1 | beta2 | ||||||||||
| + | - | S | + | - | S |
+ | - | S |
+ | - | S |
+ | - | S | |
| 1 - F7 | 5 | 3 | 8 | 2 | 2 | 4 | 3 | 5 | 8 | 3 | 2 | 5 | 9 | 3 | 12 |
| 2 - F8 | 6 | 1 | 7 | 1 | 3 | 4 | 3 | 5 | 8 | 2 | 3 | 5 | 6 | 4 | 10 |
|
3 - T3 |
2 | 4 | 6 | 4 | 4 | 8 | 4 | 4 | 8 | 4 | 3 | 7 | 7 | 1 | 8 |
|
4 - T4 |
3 | 5 | 8 | 1 | 3 | 4 | 4 | 6 | 10 | 0 | 4 | 4 | 5 | 3 | 8 |
| 5 - T5 | 3 | 5 | 8 | 0 | 5 | 5 | 5 | 4 | 9 | 0 | 6 | 6 | 5 | 4 | 9 |
|
6 - T6 |
8 | 4 | 12 | 5 | 4 | 9 | 3 | 7 | 10 | 1 | 7 | 8 | 4 | 5 | 9 |
|
9 - F3 |
6 | 6 | 12 | 2 | 3 | 5 | 2 | 3 | 5 | 1 | 9 | 10 | 7 | 3 | 10 |
| 10 - F4 | 4 | 3 | 7 | 4 | 4 | 8 | 3 | 4 | 7 | 2 | 4 | 6 | 7 | 3 | 10 |
| 11 - C3 | 4 | 6 | 10 | 4 | 7 | 11 | 4 | 5 | 9 | 1 | 6 | 7 | 6 | 5 | 11 |
| 12 - C4 | 3 | 4 | 7 | 3 | 5 | 8 | 3 | 4 | 7 | 3 | 6 | 9 | 5 | 3 | 8 |
|
13 - P3 |
4 | 3 | 7 | 3 | 6 | 9 | 5 | 5 | 10 | 2 | 6 | 8 | 3 | 3 | 6 |
| 14 - P4 | 2 | 4 | 6 | 0 | 6 | 6 | 3 | 4 | 7 | 0 | 5 | 5 | 3 | 5 | 8 |
| 15 - O1 | 0 | 7 | 7 | 1 | 5 | 6 | 3 | 6 | 9 | 0 | 8 | 8 | 3 | 6 | 9 |
| 16 - O2 | 1 | 5 | 6 | 0 | 3 | 3 | 3 | 5 | 8 | 0 | 7 | 7 | 1 | 4 | 5 |
|
|
|
|
| |
| (a) | (b) | |||
|
|
|
|
||
| (c) | ||||
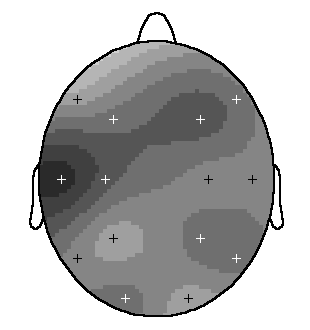
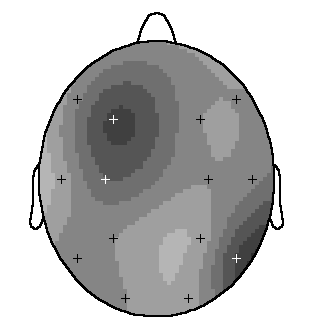
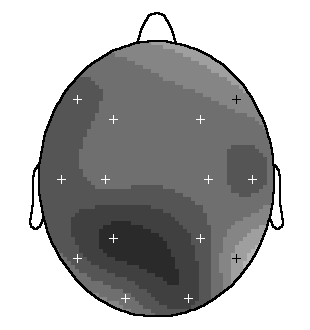
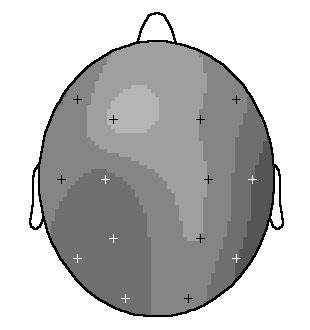
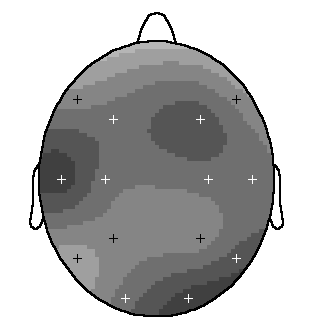
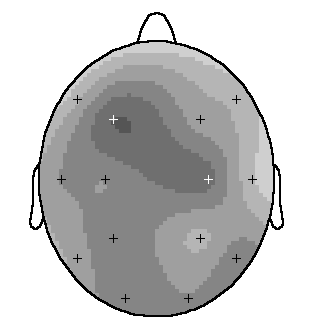
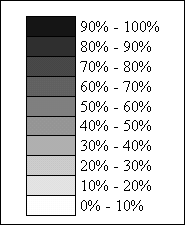
Figure 1. The topographic mappings of the number of subjects (in %) of the group 1 (left) and the group 2 (right), having the significant EEG power changes in the: (a) delta, (b) alpha, and (c) beta1 frequency bands. The gradual percentage changes are presented in various degrees of shading, as designated in the insert.
Both groups of subjects have significant changes in the EEG power over the whole head in the alpha and beta1 frequency bands, with observation that the percentage of subjects with minor reactions is much lower in the group 1. The group 2 subjects have also significant EEG power changes over the whole head in the delta frequency range.
Within the whole frequency range (1-30 Hz), 37 channels in the first group and 22 channels in the second group with the power changes in more than 50% subjects are notified. The changes are evident in delta, alpha, and beta1 frequency bands. The most prominent power changes in all frequency bands are observed in the channels 3 (T3), 11 (C3), and 12 (C4) of the group 1, and in the channels 6 (T6), 9 (F3), 11 (C3), and 13 (P3) of the group 2. The channels 3 (T3), 11 (C3), and 15 (O1) of the group 1, and the channels 6 (T6) and 11 (C3) of the group 2 have power changes in more than 50% subjects in 4 out of 5 frequency bands. In both groups of subjects a decrease in the EEG power is more frequently observed than an increase. As an illustration, in Fig.1 (a-c) the topographic mappings of the number of subjects (in %) having the significant EEG power changes in the delta, alpha and beta1 frequency band, for the two groups of subjects are presented.
3.2. Coherence analysis
Generally speaking, the changes in coherency are not too significant. Regarding the complete group of subjects, in delta frequency range the changes are observed in the backward temporal (T5 and T6), parietal (P3 and P4), and occipital (O1 and O2) regions in 25%, 25%, and 42 % of subjects, respectively. The changes in frontal region (F3 and F4) within alpha frequency band are observed in 29% of subjects, and in occipital region (O1 and O2) within beta1 frequency band in 25% of subjects. Most prominent changes, over the whole frequency interval (1-30 Hz), are registered in occipital region (O1 and O2). A decrease in the coherency is generally observed.
4. Conclusion
Upon the MRT application, a few-percentage decrease in the EEG power is observed in most subjects of both groups - the first group not previously subjected to the MRT treatment (11 subjects), and the second group of 17 subjects being subjected to the MRT in the past two years-suggesting some relaxation MRT effect. The EEG power over the whole head is particularly changed in alpha and beta1 frequency bands in both groups of subjects. The subjects of the group 1 had about 70% more MRT responding channels (reacting to MRT in over 50% subjects in all frequency bands) than the subjects of the group 2, especially in the alpha and beta1 frequency bands, which might be ascribed to the energetically more dysbalanced acupuncture system of subjects in group not previously under the MRT treatment, therefore revealing more relative changes towards the energetically normal acupuncture state.
The left parietal channel (P3) reveals the most prominent EEG power changes in both groups of subjects in the alpha band (cf. Fig.1b). The most prominent EEG power changes over the whole head are registered in the left central region (C3) of both groups of subjects, in the whole frequency interval (1-30 Hz), and this channel revealed the changes in 4 out of 5 frequency bands. It should be added that in both groups of subjects the dominant power changes within the EEG channels in all frequency bands (with the exception of beta1 band in the group 2) are registered in the left hemisphere, which might be ascribed to higher activation of the left circulatory part of the acupuncture system, as a consequence of the systematic MRT stimulation of the left-side acupuncture points Li 4, Pc 6, H 7, and Ap 55. Such a tendency is particularly significant in the theta band, in both groups of subjects, implying the higher sensitivity of the theta frequency band (4-8 Hz), which might be related to the resonance sensitivity of the acupuncture system in this ULF region, as demonstrated by the ~ 4 Hz resonance stimulation of acupuncture analgesia endorfin mechanism [5].
According to the results obtained, in further investigations attention should be paid to MRT/EEG experiments with carefully defined initial states of subjects' ultradian rhythmic activity (observable by the left/right brain's hemispheric domination and/or corresponding contralateral domination of the right/left body side). This could provide additional information on acupuncture mechanisms and the relationship between acupuncture system and nervous system. Such relation is apparent, having in mind the therapeutic acupuncture suggestions to affect the acupuncture points on the opposite side in respect to the dysfunctional part of the body - which cannot be achieved by purely acupuncture interconnecting channels (meridians), as the two acupuncture circulatory parts (left and right) are circulatory independent [1] *.
References
- Y. Omura, Acupuncture Medicine (Japan Publ. Inc., Tokyo, 1982); F.G. Portnov, Electropuncture Reflexotherapeutics (Zinatne, Riga, 1982), in Russian; A. I. Skokljev, Acupuncturology (ICS, Belgrade, 1976), in Serbian.
- H.Johari, Breath, Mind, and Consciousness (Destiny Books, Rochester, Vermont, 1989).
- E. R. Kandel, S. A. Siegelbaum, and J. H. Schwartz, Synaptic transmission, in Principles of Neural Science, E. R. Kandel, J.H. Schwartz, and T. M. Jessell, eds. (Elsevier, New York, 1991), Ch.9.
- D. Rakovic, Neural networks, brainwaves, and ionic structures: Acupuncture vs. altered states of consciousness, Acup. & Electro-Therap. Res., Int. J. 16 (1991), pp. 88-99; D. Rakovic, Brainwaves, neural networks, and ionic structures: Biophysical model for altered states of consciousness, in Consciousness: Scientific Challenge of the 21st Century, D. Rakovic and D. Koruga, eds. (ECPD, Belgrade, 1995), pp. 291-316.
- B. Pomeranz, Acupuncture research related to pain, drug addiction and nerve regeneration, in Scientific Bases of Acupuncture, B. Pomeranz and G. Stux, eds. (Springer, Berlin, 1989), pp. 35-52.
- S.P.Sit'ko, Ye.A. Andreyev, and I.S. Dobronravova, The whole as a result of self-organization, J. Biol. Physics 16 (1988) 71-73; S.P. Sit'ko and V.V. Gizhko, Towards a quantum physics of the living state, J. Biol. Physics 18 (1991) 1-10; see also S.P. Sit'ko, Quntum physics of the alive: medical aspects, this Proc. ECPD Workshop, 1997, and references therein.
- Z. Jovanovic-Ignjatic and D. Rakovic, Microwave resonance therapy: Novel opportunities in medical treatment, submitted; D. Rakovi?, Fundamentals of Biophysics (Grosknjiga, Belgrade, 1995), Chs. 3, 5, 6, in Serbian.
- H. Fr?hlich, Long-range coherence and energy storage in biological systems, Int. J. Quantum Chem. 2 (1968), pp. 641-649.
- D. Radenovic, EEG correlates of relaxation induced by microwave resonance therapy, B. Sc. thesis (Faculty of Electrical Engineering, Belgrade, 1997), in Serbian.
- H. Levine, J. R. Hebert, C. T. Haynes, and U. Strobel, EEG coherence during the Transcendental Meditation technique, in D. W. Orme-Johnson and J. T. Farrow, eds., Scientific Research of the Transcendental Meditation Program - Collected Papers, Vol. 1 (MERU Press, Seelisberg, Switzerland, 1977), pp. 187-207.
*
The praxis of Indian swara yoga [2] suggests that a higher activity of one
out of the two main lateral nadis (the left ida and the right pingala) is
accompanied by a higher activity of contralateral brain hemisphere, in accordance
with the physiologically established relationship of the contralateral brain/body
dominant activity. Then, the MRT activation of the currently energetically
deprived circulatory part of acupuncture system affects its global activation,
including ipsilateral brain hemisphere - at least as a transient phenomenon (~
5-10 min, according to the swara yoga evidence based on the transience of nasal
rhythm, having otherwise steady-state ultradian rhythm of periodicity ~ 90-120
minute [2]). Although this will be followed by successive activation of the
contralateral brain hemisphere (affected by the MRT activated pacemaker of
ultradian rhythm), it should have beneficial functional influence on the
contralateral body side further on, through the physiological mechanisms of
contralateral functional brain/body relationship. This is in agreement with the
previously mentioned therapeutic suggestions in acupuncture to affect the
acupuncture points on the opposite side in respect to the dysfunctional part
of the body - presumably via functional chain: ipsilateral acupuncture circulatory
system/ipsilateral brain hemisphere/contralateral (dysfunctional) body side.
This
also implies that the cause of the acupuncture dysfunction should be sought at
the level of contralateral brain hemisphere and even primarily at the energetic
level of contralateral acupuncture circulatory part of (still) not dysfunctional
body side. If not treated, this part would successivly evolve the same
dysfunction.
21st, The VXM Network, https://vxm.com
